
Strength from the Ground Up: The Dynamic Cone Penetrometer in Road Testing
A compact, hammer-driven instrument that delivers rapid, reliable in-situ measurement of base and sub-base shear strength — and why it has become indispensable on unpaved and rural road projects worldwide.
| <30 min to complete a full depth profile | 8 kg standard drop-hammer weight (ASTM D6951) | CBR directly estimated from DCP penetration index | 60° standard cone apex angle for soil testing |
|---|
What is the Dynamic Cone Penetrometer?
The Dynamic Cone Penetrometer (DCP) is a lightweight, portable field instrument designed to measure the in-situ bearing strength of soils and granular materials directly beneath the surface. By recording how far a standardized steel cone penetrates the ground with each hammer blow, engineers can rapidly assess the structural capacity of unpaved roadbeds, granular base courses, and base and sub-base layers, without the need for laboratory testing, expensive equipment, or significant site preparation.
Originally developed in South Africa in the 1950s and subsequently refined and standardized internationally, the DCP has become one of the most widely used geotechnical field instruments in low-volume road construction, rural infrastructure assessment, and pavement rehabilitation projects. Its combination of simplicity, portability, and quantitative rigour makes it uniquely suited to remote and resource-limited settings where conventional testing methods are impractical.
The DCP translates the empirical knowledge of the experienced engineer into a number. It turns ‘feels soft’ into data that can be compared, archived, and acted upon.
Components and How They Work Together
The DCP consists of a small number of precision-machined steel components that assemble in the field within minutes. Understanding each part clarifies both how the test works and why consistent technique is essential for reproducible results.
| Component | Specification | Function |
|---|---|---|
| Drop Hammer | 8 kg (ASTM D6951) / 4.6 kg (lightweight) | Dropped from 575 m m. Provides consistent ~45 J per blow — the foundation of test repeatability. |
| Anvil Plate | Fixed to upper shaft | Arrests hammer fall, transferring kinetic energy through the shaft to the cone tip. |
| Graduated Steel Shaft | 16 m m dia., marked in mm | Typically 1.2–1.5 m long. Couples to an extension rod for deeper profiles. |
| 60° Replaceable Cone | 20 m m base dia., hardened steel | Sacrificial tip replaced when worn to maintain consistent geometry across tests. |
Table 1 — DCP component specifications (ASTM D6951 / BS 1377 configuration).
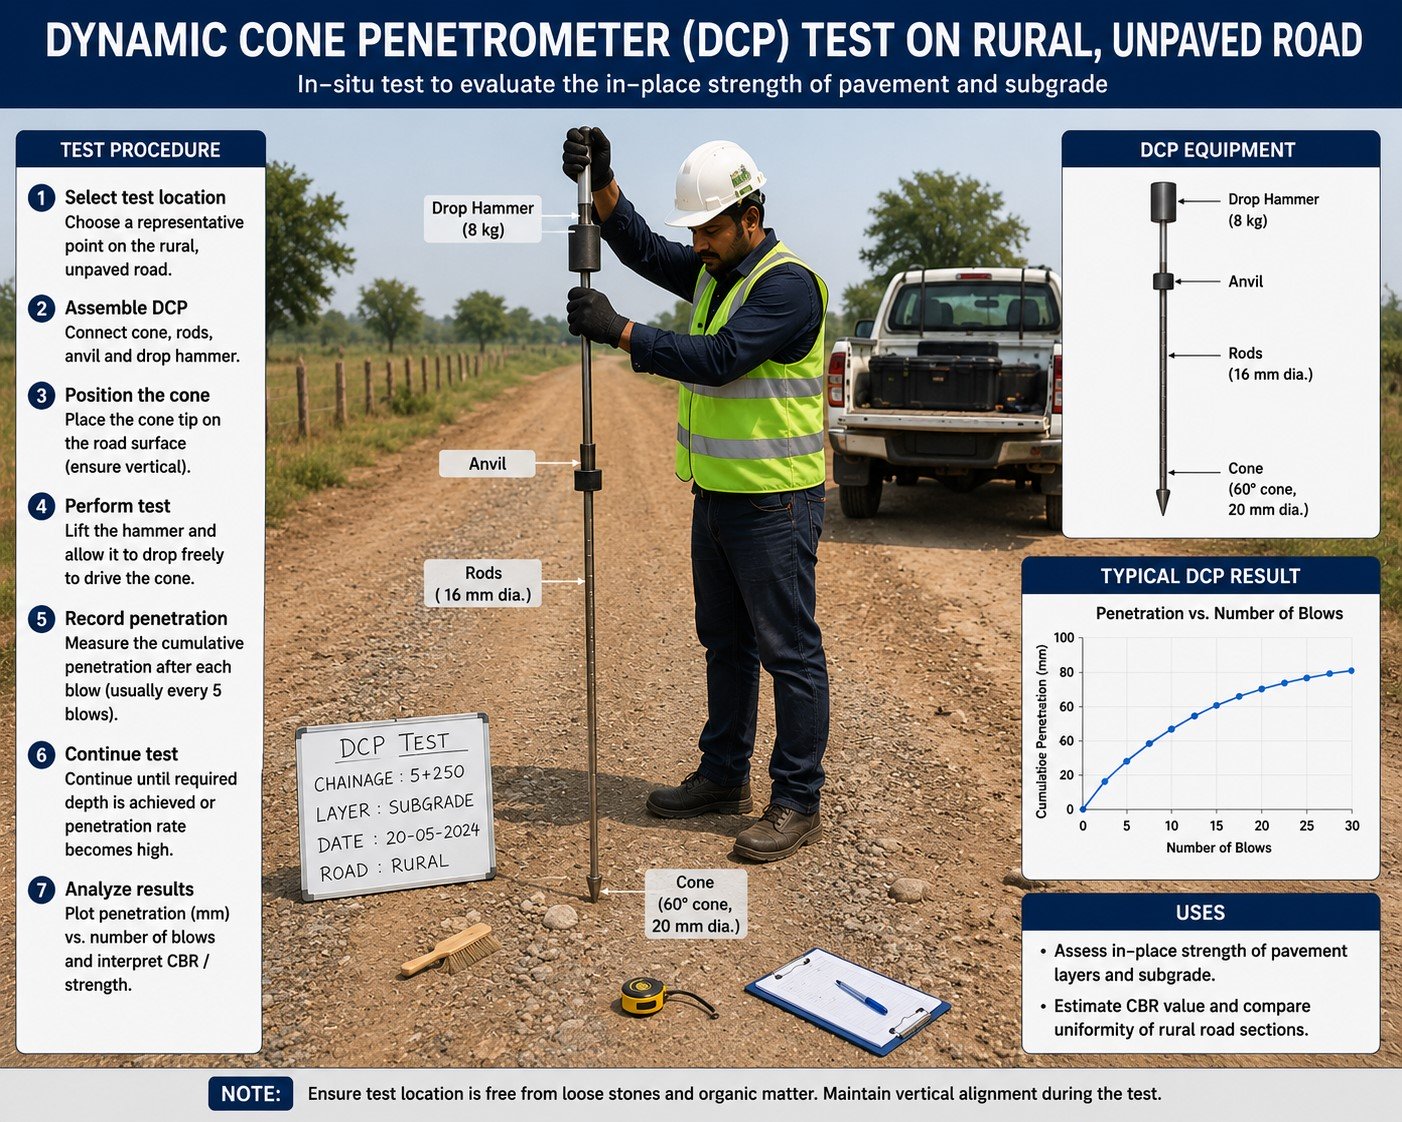
Conducting the Test: Step by Step
The DCP test is simple enough for a trained technician to conduct alone, yet rigorous enough to yield data comparable to laboratory CBR values. Standard procedure follows ASTM D6951 or the equivalent national standard.
01. Site preparation
Clear loose surface material and any vegetation. On paved roads, remove the surface layer with a coring tool or break through with a hand auger to reach the base course. Ensure the cone tip starts level with the ground surface and record the initial depth reading.
02. Seating blows
Apply two seating blows before recording data, to seat the cone in the material and eliminate the effect of surface disturbance. Discard these readings from the data log.
03. Drop and record
Raise the hammer to the marked drop height and release — do not push. After each blow, record the cumulative penetration depth in millimeters to the nearest 1 m m. Continue until the target depth is reached or refusal is encountered (penetration less than 1 m m per blow).
04. Extension and continuation
If profiling below 800 m m is required, add the extension shaft using the coupling sleeve. Note the rod addition in the data log; depth readings continue cumulatively from the last recorded value.
05. Calculate DCP index (DCPI)
The DCP index is expressed as mm/blow — penetration per hammer drop. Calculate it for each layer by dividing the change in depth by the number of blows over that interval. A low DCPI indicates strong, stiff material; a high DCPI indicates weak or loose material.
06. Correlation to CBR
Apply the established empirical correlation (e.g., log CBR = 2.465 − 1.12 log DCPI, from Kleyn et al.) to estimate California Bearing Ratio at each depth interval. Plot the profile to identify weak layers, layer boundaries, and compaction anomalies.
Reading the DCP Profile
The raw output of a DCP test is a table of cumulative depth against cumulative blow count. Plotted as a graph, this becomes the DCP profile — one of the most information-rich outputs in field pavement investigation. The slope of each segment of the curve directly indicates the DCPI and, by extension, the relative strength of each material layer encountered.
A steep slope (many blows for little penetration) represents strong, well-compacted material. A shallow slope (rapid penetration per blow) signals weakness — saturated soils, insufficient compaction, or material degradation. Sudden changes in slope identify layer boundaries with a precision that can be cross-checked against borehole logs or excavation.
Table 2 — DCPI to CBR interpretation guide
| DCPI (mm/blow) | Est. CBR (%) | Interpretation |
|---|---|---|
| < 5 | > 30 | Well-compacted base course — suitable for most applications |
| 5 – 10 | 15 – 30 | Moderate strength — acceptable base or sub-base for light traffic |
| 10 – 25 | 5 – 15 | Weak to marginal — may require stabilization under heavy loads |
| > 30 | < 5 | Very weak — stabilization, replacement, or traffic restriction needed |
Correlations based on Kleyn (1975) and USACE (2001). Apply within validated DCPI range of 1–76 m m/blow.
Interpretation NoteDCPI below 5 m m/blow generally corresponds to CBR above 30% — acceptable for most base course applications. DCPI between 10–25 m m/blow suggests base and sub-base CBR in the range of 5–15%, which may be marginal depending on traffic loading. Values above 30 m m/blow indicate very weak material (CBR <5%) that typically requires stabilization, replacement, or significant traffic restriction.
Where the DCP Delivers Most Value
Unpaved road assessment. Rapidly characterize the strength profile of gravel, laterite, or natural surface roads before rehabilitation design, identifying weak zones that require targeted intervention.
Layer thickness detection. Identify compacted layer boundaries and base and sub-base depth without costly trial pits or coring — a slope change in the DCP profile marks a material transition with millimeter resolution.
Compaction quality control. Verify that newly placed fill and base material has achieved target density during construction, in real time, allowing immediate corrective action before the next layer is placed.
Problem spot diagnosis. Investigate localized failures — rutting, cracking, settlement — by profiling the material beneath the distress to determine whether the cause is in the base, subbase, or subgrade.
Seasonal monitoring. Track strength changes through wet and dry seasons to understand moisture sensitivity and plan maintenance interventions at the most cost-effective time in the annual cycle.
Network-level surveys. Perform rapid, repeatable testing at regular chainage intervals across an entire road network to generate a prioritized investment program based on measured condition.
What the DCP Does Well — and Where It Falls Short
Like all geotechnical instruments, the DCP is most powerful when its users understand both its strengths and its boundaries. The instrument excels in situations that demand speed, portability, and directness. It has limitations in specific material types and can only estimate — rather than directly measure — certain engineering parameters.
Advantages
Rapid deployment. A complete profile to 800 m m takes under 30 min utes with a two-person team. No power source or ancillary equipment required.
Immediate results. Data are available on site, enabling real-time decisions during construction or investigation without laboratory turnaround delays.
Cost-effective. Low equipment cost and minimal consumables make wide network coverage feasible even under constrained budgets.
Limitations
Coarse gravels and rockfill. Material with particles larger than 50 m m can deflect or damage the cone tip, producing erratic readings not representative of bulk strength.
Very stiff materials. At DCPI below 1–2 m m/blow, meaningful discrimination is lost. Cemented or stabilised layers may cause apparent refusal before full penetration.
Empirical CBR correlation. The DCP-to-CBR relationship was derived from specific soil types. Applying it to highly plastic clays, organic soils, or materials outside the calibration dataset introduces uncertainty.
No moisture or density data. The DCP measures resistance only. Complementary tests — nuclear density gauge or sand replacement — are required where moisture content and dry density matter independently.
Key Standards and the CBR Relationship
The DCP is governed by several internationally recognized standards, each with slightly different hammer masses and drop heights. Engineers must ensure the correct correlation formula is used for the specific configuration employed.
The most widely cited empirical correlation for estimating CBR from DCPI (in mm/blow) is the relationship developed by Kleyn (1975) and subsequently validated by the US Army Corps of Engineers: log(CBR) = 2.465 − 1.12 × log(DCPI). For granular materials specifically, the USACE recommends: log(CBR) = 2.555 − 1.145 × log(DCPI). Both equations should be applied within the validated DCPI range of approximately 1–76 m m/blow.
Standards ReferenceASTM D6951/D6951M — Standard test method for use of the DCP in shallow pavement applications. BS 1377-9 — UK method for in-situ CBR testing. TRL Laboratory Report 623 — foundational calibration study (UK Transport Research Laboratory). South African TMH5 Method A30 — DCP testing on roads. USACE TR-06-7 — Validation and extension of DCP correlation equations for US military pavement applications.
A Field Instrument That Earns Its Place
The Dynamic Cone Penetrometer occupies a rare position in the geotechnical toolkit: it is simultaneously one of the simplest instruments available and one of the most practically useful. For engineers working on rural and unpaved roads — where laboratory facilities are distant, budgets are constrained, and the variability of natural materials is high — the DCP provides an immediate, structured window into the strength of the ground beneath their feet.
Used carefully, with proper attention to technique, consistent equipment calibration, and appropriate correlation equations for local soils, the DCP supports decisions that would otherwise rely on experience alone. It bridges the gap between field intuition and engineering rigour — rapidly, affordably, and with a level of resolution that continues to make it the first instrument out of the bag on low-volume road projects around the world.
In remote road engineering, the DCP is often the only structured test that will actually happen. Making it count begins with understanding what it is — and is not — measuring.